The Killeen Housing Market, Honestly
Five years of closed-sale data on the Killeen, TX housing market — what home prices actually did, why inventory matters more than price right now, and what it means if you are buying or selling near Fort Hood.
The Killeen housing market in 2026 is a slow market with stable prices, not a crashing one. The median sale price is $232,250 as of August 2026 — about 7% below the July 2022 peak of $249,900, and roughly flat over the last three years. What actually changed is supply and speed: active listings rose from 283 to 684, months of inventory went from 1.0 to 5.6, and annual closings fell from 2,819 in 2022 to a 2026 pace near 1,428.
Ask ten people what the Killeen housing market has done since 2022 and you will get ten answers, most of them wrong in one direction or the other. So we pulled the closed-sale record for every month from July 2021 through August 2026 and looked at it without a thumb on the scale.
Key takeaways
- The Killeen housing market median sale price has stayed inside a $209,500 to $249,900 band for 50 straight months.
- Adjusted for inflation, Killeen home values are down roughly 18% from the summer of 2022.
- Buyers who purchased before 2022 are still well ahead — the average sale price is up 11.4% since the second half of 2021.
- Inventory growth has nearly stopped: only 22 net listings were added between August 2025 and August 2026.
- Killeen housing market sales declines are shrinking every year, from −30.1% in 2023 to −7.6% so far in 2026.
★What the Killeen housing market has actually done since 2022
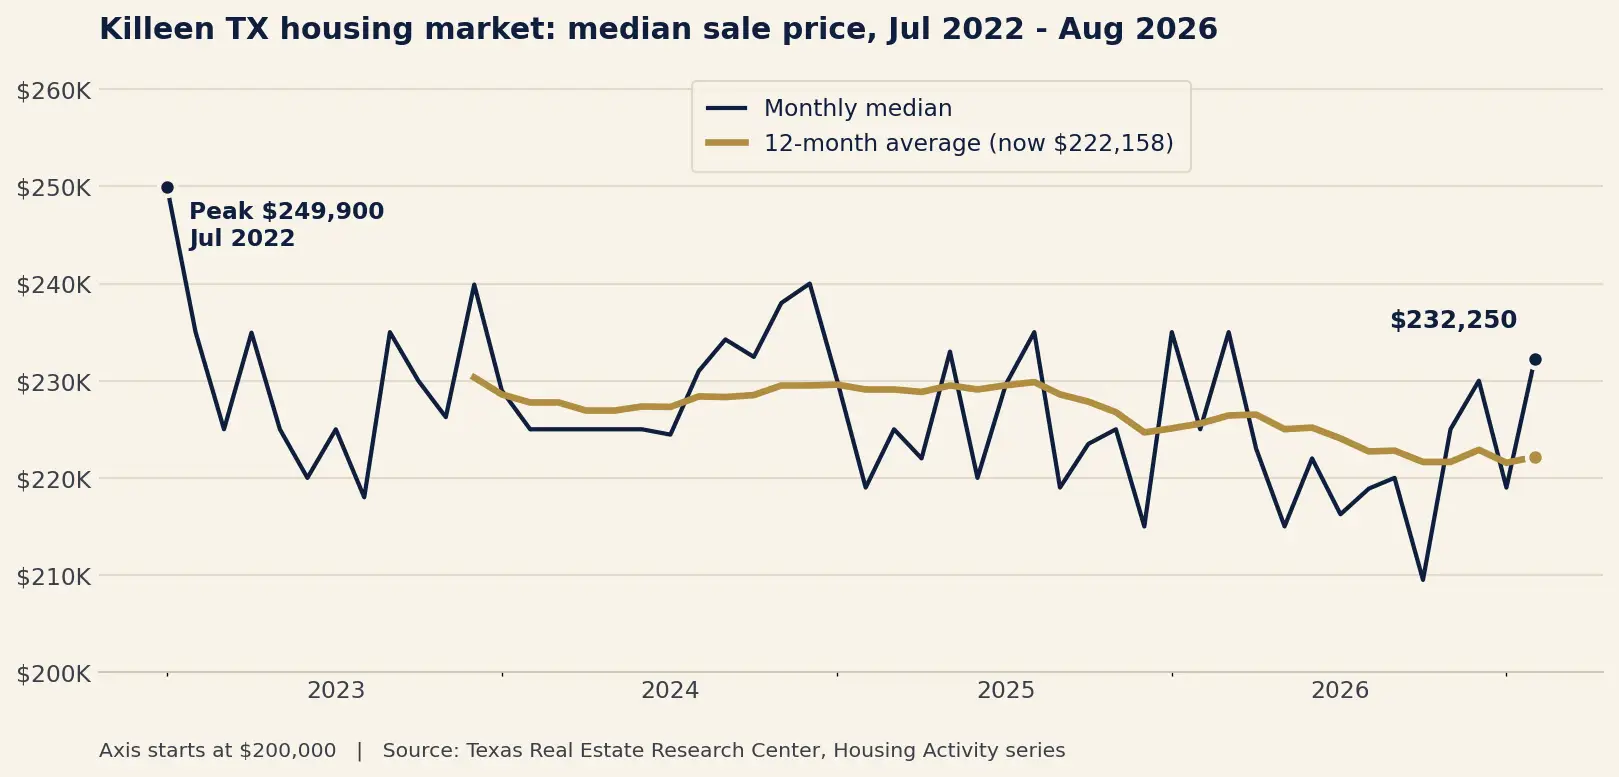
Killeen’s median sale price topped out at $249,900 in July 2022. Four years later it sits at $232,250. That is a decline of about 7.1% — and that is the entire move.
In between those two points, the median never once closed a month above $250,000 or below $209,500. That is a band of roughly $40,000, or about eight percent either side of the middle, held for fifty consecutive months. By the standards of what people expected after 2022, the Killeen housing market has been remarkably boring.
Smoothing the month-to-month noise makes the drift easier to see. The rolling 12-month average of the median went from $227,758 in August 2023 to $222,158 in August 2026 — a decline of just 2.5% over three full years. That is not a correction. That is a plateau with a slight downhill grade.
Why single months look scarier than they are
The Killeen housing market closes between 76 and 174 homes in a typical month. At that volume, a handful of unusual sales can move the median five thousand dollars in either direction. April 2026 printed a median of $209,500 and set off a round of “the market is collapsing” talk. Two months later, June 2026 printed $230,000. Neither number meant much on its own. The twelve-month average is the honest read.
★The Killeen housing market is flat in dollars, down after inflation
Here is the part the price chart hides. Consumer prices rose 13.3% between July 2022 and August 2026. A median-priced Killeen home fell 7.1% in dollars over that same stretch. Put those together and the same house has lost roughly 18% of its purchasing power in four years.
Two owners, two very different outcomes
If you bought at the 2022 peak with a low down payment, you may be close to break-even or slightly underwater once you account for selling costs. Time, not price growth, is what fixes that.
If you bought before the run-up, you are fine. The average Killeen sale closed at $208,232 in the second half of 2021. The average over the last twelve months is $231,974 — still 11.4% higher in dollar terms.
This is the conversation we would rather have up front than three weeks into a listing. It is also why we ask every seller the same question before we take an assignment: would you like us to tell you the truth, or would you prefer we tell you what you want to hear?
★The real Killeen housing market story is inventory, not price
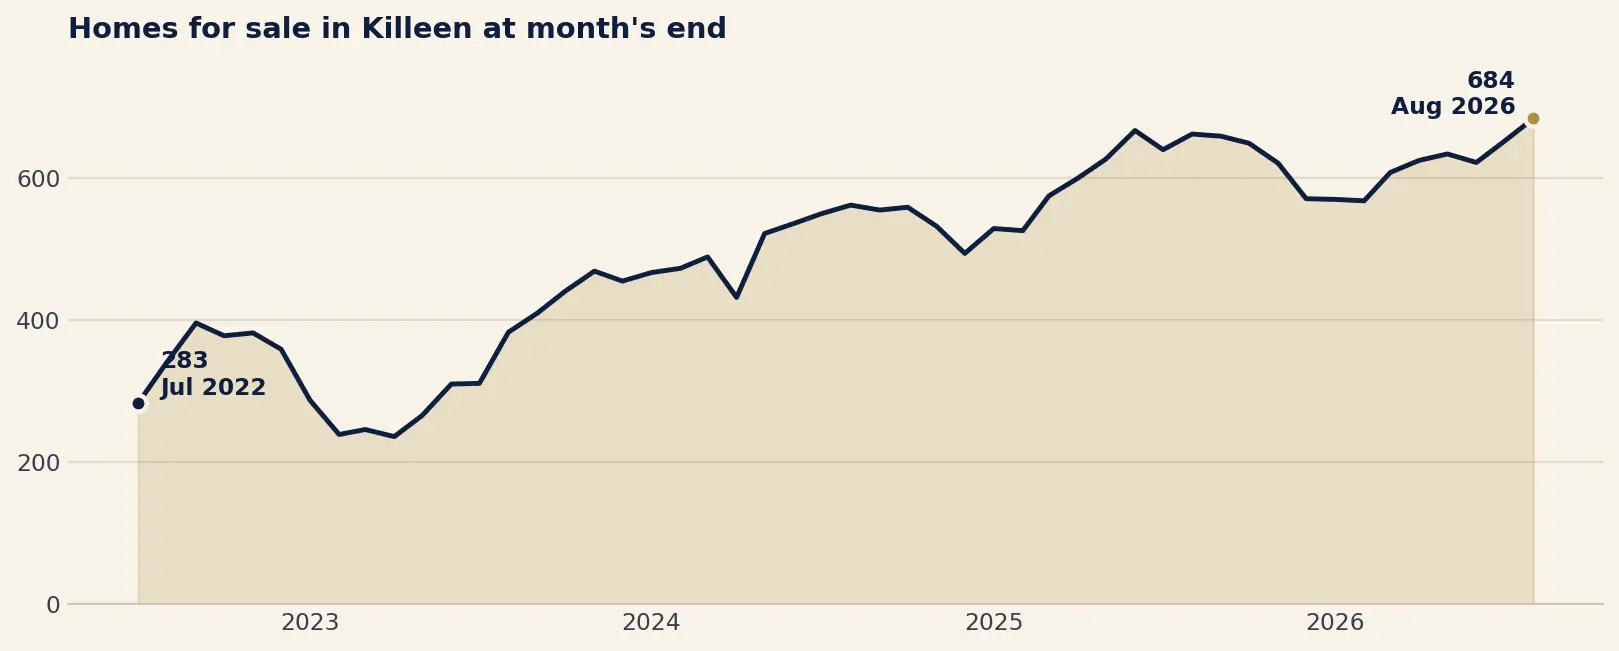
In July 2022 there were 283 homes for sale in Killeen at month’s end, and 1.03 months of inventory. That is about as tight as a housing market can physically get. In August 2026 there were 684 homes for sale and 5.61 months of inventory. Listings up 142%. Months of supply up 445%.
Texas convention treats roughly six to six and a half months as a balanced market. The Killeen housing market has spent four years traveling from an extreme seller’s market to the doorstep of balance. That single shift — not a price crash — is what changed how a Killeen transaction feels: longer marketing times, more seller concessions, more repairs negotiated, and far fewer multiple-offer situations.
The build-up is nearly over
Measured every August, active listings went 341, then 383, then 562, then 662, then 684. The big jump was 2024. The last twelve months added only 22 listings. Supply is still growing, but it has almost stopped accelerating — which is usually the first thing that turns before a market steadies.
★Half as many homes are selling
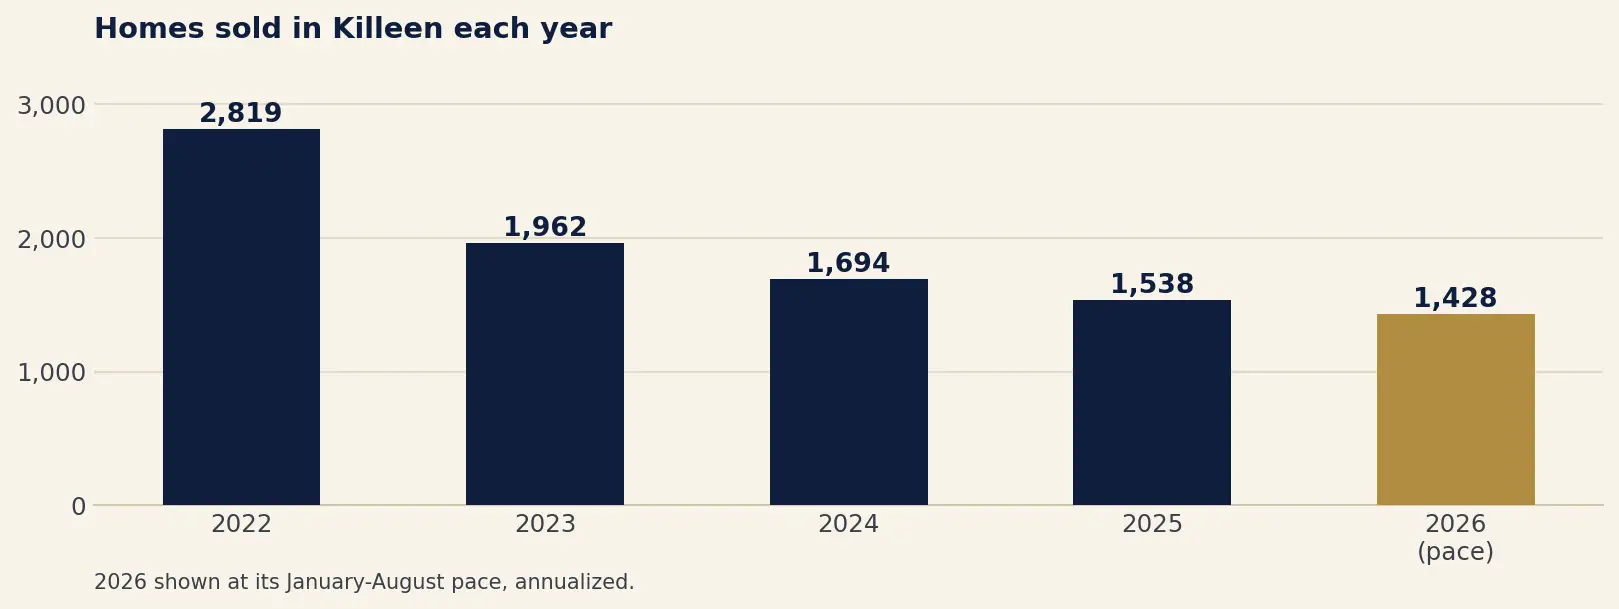
Prices held. Transactions did not. The Killeen housing market closed 2,819 homes in 2022. In 2025 it closed 1,538. Through August, 2026 is running at a pace of roughly 1,428 — about half the 2022 market, four years later.
Dollar volume tells the same story with a sharper edge: $657.3 million moved through the Killeen market in 2022 against $359.3 million in 2025, a 45% drop. January 2026 was the thinnest single month in the record at just 76 closings. July 2022 was the fattest, at 273.
One genuinely encouraging signal
The year-over-year declines are getting smaller every single year. Sales fell an average of 30.1% per month in 2023, 12.6% in 2024, and 7.6% in both 2025 and 2026. August 2026 was down only 5.7% in sales and 2.2% in dollar volume — among the mildest year-over-year readings anywhere in the series. The market is still shrinking, but it is shrinking more slowly each year.
★Killeen housing market: home sales year by year
| Year | Homes Sold | Dollar Volume | Average Sale Price | Homes For Sale (Dec) | Months Inventory (Dec) |
|---|---|---|---|---|---|
| 2021 (Jul–Dec) | 1,783 | $371.3M | $208,232 | n/a | n/a |
| 2022 | 2,819 | $657.3M | $233,180 | 359 | 1.53 |
| 2023 | 1,962 | $465.7M | $237,366 | 455 | 2.78 |
| 2024 | 1,694 | $400.9M | $236,633 | 494 | 3.50 |
| 2025 | 1,538 | $359.3M | $233,597 | 571 | 4.46 |
| 2026 (Jan–Aug) | 952 | $221.1M | $232,277 | 684 | 5.61 |
Notes: July 2021 through June 2022 figures are reconstructed from the published year-over-year percentages, so sales, dollar volume and average price are available for that window but median price and inventory are not. The 2026 row covers January through August; its last two columns show August 2026.
What Is Your Killeen Home Worth In This Market?
A Killeen housing market average is not a valuation. Get a free, no-obligation home value report built from the actual comparable sales in your neighborhood — prepared by a Killeen broker who has been doing this since 1994.
★What the Killeen housing market means if you are selling
The Killeen housing market now carries 684 active listings against about 115 closings a month. Roughly one listing in six sells in a given month, which means price and condition are doing all the work. Four things follow from that.
Stop pricing off 2022 comps
- The peak median was $249,900 in July 2022.
- Today’s median is $232,250.
- The last six months have averaged $222,625.
- A price set from a neighbor’s 2022 sale will sit, then chase the market down.
Expect to contribute
- At 5.6 months of supply, buyer concessions and repair credits are the norm, not the exception.
- Budget for them at listing, not as a surprise at closing.
- A rate buydown often moves a buyer further than an equivalent price cut.
Your competition roughly tripled
- 283 listings in July 2022 became 684 in August 2026.
- Photography, staging and a real marketing plan are now the difference between selling and expiring.
- See our Fort Hood area selling strategy.
Time the listing, not the market
- Killeen closings peak March through July.
- That means listing in January and February.
- Waiting for a better market has cost sellers money in each of the last four years.
★What the Killeen housing market means if you are buying
Buyers in the Killeen housing market have more leverage today than at any point in the last decade. That is a real advantage, and it comes with one warning.
- Selection is back. Inventory went from one month of supply to nearly six in four years. You can see ten homes, sleep on it, and most of them will still be there.
- Prices have not run away from you. The median has moved inside a $209,500 to $249,900 band for four straight years while rents and wages did not stand still.
- Sellers are negotiating. Closing-cost help, repairs and rate buydowns are all routinely on the table at this level of supply.
- Winter is your window. January and February 2026 saw just 76 and 93 closings against roughly 570 active listings — the thinnest competition of the year.
- Do not wait for a crash. Four years of falling sales produced a 7% price decline, not a collapse. The floor under Killeen prices has been stubborn, and Fort Hood keeps demand from disappearing the way it can in a one-employer town.
If you are using a VA loan, the current market is about as favorable as it has been since 2019: more inventory to choose from, sellers willing to cover costs, and appraisal pressure far lower than it was in 2022. Our Central Texas home buyer guide and mortgage calculator are both good starting points, and you can get pre-qualified before you tour anything.
★When the Killeen housing market actually trades
The Killeen housing market calendar is driven by the Fort Hood cycle, and it is remarkably consistent. Averaging 2023 through 2026, here is how a year unfolds.
- January — the trough, about 100 closingsThe slowest month of the year, every year. Best month to be a buyer; worst month to expect showings.
- February — about 126 closingsActivity turns. Homes listed now are the ones closing in April and May.
- March through July — the plateau, 153 to 158 closingsFive straight months of peak volume, lined up with PCS season. This is when Killeen sells.
- August through October — 134 to 144 closingsA steady, workable stretch that most people underrate.
- November — the second dip, about 117 closingsHolidays thin the buyer pool, but the buyers who are out are serious.
- December — about 131 closingsYear-end tax and PCS timing pushes a surprising number of deals across the line.
The practical version
A March closing needs a January listing. If you want to be sold and moved before the summer PCS rush, the decision to list happens right after the holidays — not in April when everyone else lists.
★Where these Killeen housing market numbers come from
Every Killeen housing market figure on this page comes from closed MLS sales for the Killeen market area, published monthly by the Texas Real Estate Research Center at Texas A&M University. We pulled sales counts, dollar volume, average and median sale price, active listings at month’s end, and months of inventory for every month from July 2021 through August 2026 and calculated the rest ourselves.
Three things worth knowing about the data. First, it covers MLS-reported sales, so new construction sold directly by a builder outside the MLS is not included. Second, figures for July 2021 through June 2022 are reconstructed from the published year-over-year percentages, which is why median price and inventory are blank for that window. Third, the inflation adjustment uses CPI-U, which rose from 294.913 in July 2022 to 334.131 in August 2026 — an increase of 13.3%.
For wider context, asking prices across the broader Killeen–Temple metro — which folds in Temple, Belton, Harker Heights and Salado — went from $167,700 in July 2016 to a peak of $333,950 in May 2023, and sit near $284,000 today. That is up about 69% over a decade and down 15% from the peak. A metro asking price and a Killeen sale price are different measures over different areas, so they are not in conflict; the gap between them is simply the spread between what sellers want and what buyers pay, and it has widened since 2022.
★Killeen housing market questions we get asked
Are home prices going down in Killeen, TX?
Slightly, and slowly. The median sale price in Killeen was $232,250 in August 2026, down about 7.1% from the July 2022 peak of $249,900. Measured on a 12-month average, prices fell only 2.5% over the three years to August 2026. The Killeen housing market has had a long plateau with a gentle downward drift, not a crash.
Is Killeen a buyer’s market or a seller’s market in 2026?
Killeen is close to a balanced market that still tilts toward buyers. Months of inventory reached 5.61 in August 2026, up from 1.03 in July 2022. Texas generally treats six to six and a half months as balanced, so Killeen is just short of neutral — which in practice means buyers can negotiate on price, repairs and closing costs.
What is the average home price in Killeen, Texas?
The average sale price in the Killeen housing market over the twelve months ending August 2026 was $231,974. The median — the middle sale, which is the better number for most buyers and sellers — was $232,250 in August 2026.
How long does it take to sell a house in Killeen right now?
At 5.6 months of inventory, roughly one active listing in six sells in a given month. A correctly priced home in good condition still moves quickly; an overpriced one can sit for a full season. Pricing and presentation matter far more in 2026 than they did in 2022.
Will Killeen home prices go up in 2027?
Nobody can promise that, and anyone who does is guessing. What the Killeen housing market data shows is that the declines are decelerating: sales fell 30.1% on average in 2023 but only 7.6% in 2026, inventory added just 22 net listings in the last twelve months, and August 2026 dollar volume was down only 2.2% year over year. Those are the conditions that normally precede a market steadying rather than falling further.
Is now a good time to buy a house near Fort Hood?
For a buyer who plans to stay three to five years or longer, the current market offers the best selection and the most negotiating room since roughly 2019. The main caution is that prices have been flat, so buying with the expectation of quick appreciation is not supported by the last four years of Killeen data.
Data sources: Texas Real Estate Research Center, Housing Activity series, Killeen market area, July 2021 – August 2026 (MLS closed sales). Median list price for the Killeen–Temple CBSA from Realtor.com residential listings data. Inflation adjustment from the U.S. Bureau of Labor Statistics Consumer Price Index for All Urban Consumers. Percentages calculated from unrounded figures. Published 22 September 2026 and reviewed quarterly.
Find Out What Your Home Is Worth Today
Averages describe a market. They do not price your house. Tell us about your property and we will send you a free home value report built from the real comparable sales on your street — and an honest opinion about what it would take to sell it.